

Following the eruption of the Etna volcano that began on 24 December 2018 and the seismic swarm that accompanied this event and is still continuing, within the framework of the activities coordinated by the Department of Civil Protection, the researchers of the CNR-IREA and the INGV Sections of Catania-Osservatorio Etna and the National Earthquake Observatory of Rome measured the permanent movements of the ground thanks to the Italian COSMO-SkyMed and European Sentinel-1 satellite radars. Maximum displacement values exceeding 30 cm towards the West and 50 cm towards the East have been highlighted on the summit of Etna and, in the area activated by the Mw 4.9 earthquake, a maximum displacement towards the East of about 13 cm, and one towards the West about 16cm
Following the lateral eruption of the Etna volcano that began on 24 December 2018 and the Mw 4.9 magnitude seismic event localized by the National Institute of Geophysics and Volcanology (INGV) in the Viagrande area (CT), the Civil Protection Department (DPC ) activated the National Research Council - Institute for Electromagnetic Sensing of the Environment (CNR-IREA) of Naples, as a center of expertise in the sector of satellite radar data processing, for an analysis aimed at measuring movements of the resulting soil.
The eruption and the seismic sequence with the Mw 4.9 mainshock recorded so far have been monitored from the outset by the INGV of Catania and Rome and are constantly monitored 24 hours a day by means of the seismic and geodetic networks. As part of its monitoring activities of the Etna volcano also carried out through gravimetric and magnetic networks, geochemical (gas flows in the plume, from the ground and from fumaroles), thermal and "in the visible field" cameras and with site inspections, the headquarters of the INGV of Catania - Osservatorio Etneo, in collaboration with the Rome headquarters - National Earthquake Observatory, also carried out a preliminary analysis of the satellite radar data relating to the eruption that began on 24 December 2018 and the associated seismic swarm, to be integrated with information provided by other monitoring systems.
Using the radar data of the European satellites Sentinel-1 (S1), of the European Copernicus program, and those of the Italian constellation COSMO-SkyMed (CSK), of the Italian Space Agency (ASI) - competence center for data acquisition and use satellites - and the Ministry of Defence, a team of researchers from CNR-IREA and INGV have detected the fracture that fed the lava flow caused by the eruption and measured the permanent movements of the soil with high precision, using the 'Differential SAR Interferometry. This technique allows, by comparing radar images acquired before and after the seismic events, to measure, along the line of sight (LOS, Line of Sight) of the sensor, the displacement of the ground that occurred in the time interval between the two acquisitions, with accuracy centimetre. Furthermore, having the passages from different orbits (ascending and descending) it is also possible to reconstruct the horizontal (in the East-West direction) and vertical component of the deformation field detected.
Table 1 shows the interferometric pairs of radar images whose results are shown below.
Table 1: Co-seismic interferometric pairs used for the conducted analysis
| Sensor | Interferometric pair | Wavelength [cm] | Perpendicular Baseline[m] | Orbita |
| S1B-S1A | 22122018-28122018 | 5.56 | 65 | DISC |
| S1A-S1B | 16122018-28122018 | 5.56 | 66 | ASC |
| S1A-S1B | 22122018-28122018 | 5.56 | 160 | ASC |
| CSK | 23102018-26122018 | 3.12 | 279 | DISC |
Figure 1 shows a comparison between the amplitude (module) images acquired by the CSK constellation before and after the analyzed volcanic and seismic events, as reported in Table 1. Thanks to the high resolution of the CSK sensors (of the order of a few meters ), in the post-events image you can clearly see the formation of the fracture that fed the lava flow caused by the eruption that began on December 24th. It should be emphasized that the CSK constellation, following the request for intervention for the ongoing emergency, acquired the first image less than 24 hours after the seismic event and further acquisitions were made on December 30th to ensure continuity of monitoring of the area of interest. Note that in Figure 1 the images represented in radar coordinates have been reported rather than in geographical or cartographic coordinates to avoid emphasizing the geometric distortions due to the topography of the area and the acquisition geometry of the radar sensor (view angle 34°) .
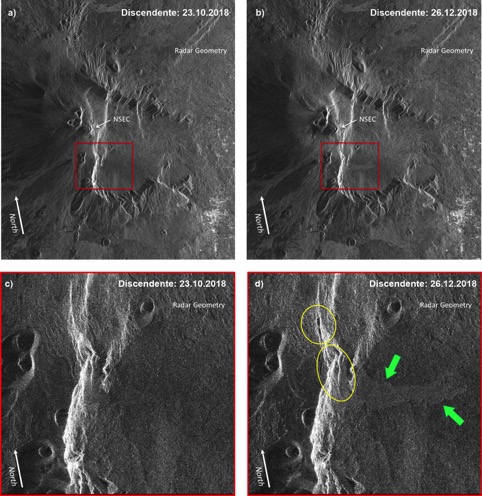
Figure 1 – Comparison between CSK amplitude images, represented in radar coordinates, acquired before and after the analyzed events; (a) pre-event CSK amplitude image acquired on 23102018; (b) post-event CSK amplitude image acquired on 26122018 (the red box is related to the area zoomed in panels (c) and (d)); (c) zoom of the pre-event CSK image of the area affected by the fracture and the consequent lava flow; (d) zoom of the post-event CSK image relating to the area affected by the fracture (highlighted with yellow ellipses) and the consequent lava flow (highlighted with green arrows). CSK data is copyright of ASI (2018).
Figure 2(a,b) shows the ground displacement maps, in LOS, obtained starting from the pairs of data S1 reported in Table 1, calculated in the pixels characterized by a good quality of the interferometric signal (called coherent pixels). Furthermore, in Figure 2(c,d) the maps of the Horizontal (in East-West direction) and Vertical components of the measured ground displacements are shown, which were estimated starting from the joint use of the LOS deformation maps of Figure 2 (a) and Figure (2b), obtained respectively from ascending (for which the satellites move from South to North) and descending (for which the satellites move from North to South) orbits. The analysis of the results obtained shows that the map of the displacements in the East-West direction (Figure 2c) shows the most significant entities, whose maximum values exceed 30 cm towards the West and 50 towards the East on the summit of the volcano. In the area corresponding to the earthquake of 26 December (Mw4.9), the maximum displacement towards the east is 12-14 cm, while the corresponding one towards the west is 15-17 cm.
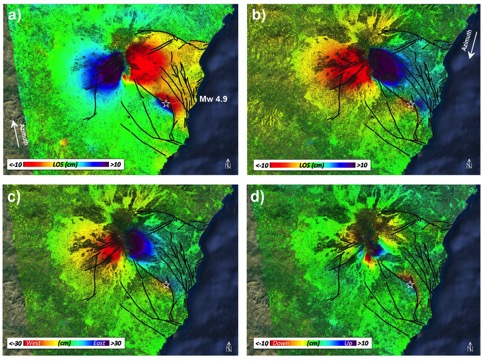
Figure 2 – LOS deformation maps obtained from Sentinel-1 SAR data (a,b) and maps of the horizontal (East-West direction) and vertical components of ground displacements estimated from LOS maps (c,d ). In detail: (a) map obtained from the ascending interferometric pair S1 relating to the interval 16122018 – 28122018; (b) map obtained from the descending interferometric pair S1 relating to the interval 22122018 – 28122018; (c) horizontal (East-West) component of measured ground displacements; (d) vertical component. S1 data is copyright of Copernicus (2018).
Figure 3 shows the results of the interferometric processing in phase and in displacement along the line of sight of the Sentinel 1A/1B interferometric pairs 22/12/2018–28/12/2018 acquired in ascending and descending geometry, carried out by the laboratories of INGV remote sensing. The two figures show the line-of-sight measurements of the sensor, respectively in ascending and descending geometry. The deformation field that is detected is the sum of the effects of several sources. The images highlight the deformation caused by the dike intruded on 24 December in the upper Valle del Bove, - by the Fiandaca-Pennisi fault (FPF; lower south-east slope) which moved during the Mw 4.9 event of 26/ 12/18, and three other faults with minor displacements, the Pernicana fault (PFS; NE flank), the Ragalna fault (RFS; upper SW flank) and the Borello-Ognina fault (BOF; lower flank southern). The Fiandaca-Pennisi, Pernicana and Ragalna faults were activated during the seismic swarm still recorded by the INGV networks of Etna. In addition to these deformations, the general movement of the eastern flank is recorded, as already known from numerous previous studies.
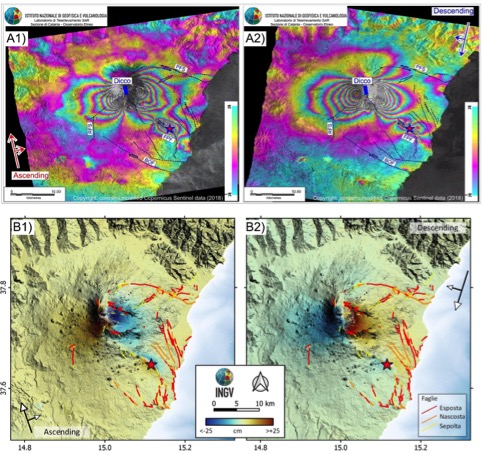
Figure 3 – LOS interferograms obtained from Sentinel-1 SAR data and LOS strain maps obtained from interferograms. In detail: (A1) map obtained from the ascending interferometric pair S1 relating to the interval 22122018 – 28122018; (A2) map obtained from the descending interferometric pair S1 relating to the interval 22122018 – 28122018; (B1) strain in LOS corresponding to interferogram A1 and (B2) strain in LOS corresponding to interferogram A2. S1 data is copyright of Copernicus (2018).
It should be noted that quickly obtaining a synoptic picture of the deformations and displacements of the soil caused by volcanic and/or seismic events represents one of the objectives of the Civil Protection Department, during an emergency phase. In this specific case, the results obtained are the result of the long and consolidated collaboration between the Department and its Centers of Competence – in this case CNR-IREA, ASI and INGV. Based on their expertise, these centers support the DPC in the use of satellite data and information and in their integration with in situ data provided by the other Competence Centres. This activity has allowed the development of products, methods and procedures that have improved the capabilities of the National Civil Protection Service in emergency response. The CSK System is the largest national space asset currently operational and is currently made up of a constellation of four satellites. The launch of the first of a new generation of technologically more advanced satellites (CSG - COSMO-SkyMed Second Generation) is planned by 2019 followed by the launch of a second satellite one year later. Furthermore, the construction of two further CSG satellites was recently approved at government level, demonstrating the current national and international strategic and applicative relevance of the Italian system, the only four-satellite constellation currently operational on the global scene.
![]()
![]()
![]()
![]()