

Attraverso una diversa interpretazione dei dati rilevati nel parossismo di Stromboli del 3 luglio 2019, gli scienziati hanno elaborato un nuovo modello di funzionamento del sistema di alimentazione del vulcano
I dati del monitoraggio di Stromboli sono stati analizzati con un nuovo approccio dagli scienziati. Lo studio ha evidenziato possibili ulteriori segnali e meccanismi da attenzionare nelle fasi di “irrequietezza” del vulcano (cd. unrest). È questo lo spunto offerto dalla ricerca , recentemente pubblicata sulla rivista internazionale ‘Remote Sensing’ di MDPI.
Lo studio, condotto da un team di ricercatori dell’Istituto Nazionale di Geofisica e Vulcanologia (INGV) in collaborazione con il Prof. Roberto Scarpa dell’Università di Salerno e con il Prof. Carmelo Ferlito dell’Università degli Studi di Catania, è stato effettuato analizzando a posteriori i segnali che hanno preceduto il parossismo di Stromboli del 3 luglio del 2019.
“Osservando da un nuovo punto di vista i dati che vengono normalmente acquisiti a Stromboli dalle nostre reti di monitoraggio multiparametriche”, spiega Mario Mattia, ricercatore dell’INGV e primo autore della ricerca, “siamo stati in grado di ricostruire la sequenza della fase di unrest del vulcano che ha preceduto l’evento del 3 luglio 2019”.
Analizzando l’insieme dei dati a disposizione (dati geodetici, satellitari, delle telecamere, dati termici e di deformazione del suolo acquisiti tramite strumenti ad alta precisione), i ricercatori hanno scoperto dei possibili cambiamenti nello stato del vulcano evidenziabili nei momenti immediatamente precedenti la crisi parossistica.
“I parossismi come quello del 3 luglio sono particolarmente pericolosi poiché producono dei segnali estremamente difficili da interpretare: si pensi, ad esempio, al conteggio del numero delle esplosioni o degli eventi VLP, ovvero eventi sismici a bassa frequenza tipici dei vulcani attivi, che non vanno incontro a un incremento significativo nelle fasi precedenti un parossismo”, prosegue Mattia. “Partendo da queste considerazioni, ci siamo concentrati su alcuni specifici parametri, come i segnali ad alta frequenza registrati dai dilatometri, ovvero dei sensori posti in foro profondo a circa 200 metri sotto la superficie che misurano le più piccole variazioni delle deformazioni del suolo: abbiamo notato che questi segnali corrispondevano effettivamente a quelli VLP registrati dai sismografi, tuttavia presentavano una forma d’onda specifica che, prima del 3 luglio, è improvvisamente cambiata”.
Inoltre, utilizzando un algoritmo automatico sono state rianalizzate le immagini riprese dalle telecamere di sorveglianza presenti a Stromboli. In tal modo, i ricercatori hanno notato un incremento nell’intensità e nell’energia delle esplosioni del vulcano già a partire da circa un mese prima del parossismo di inizio luglio.
“A partire da queste nuove letture dei dati già in nostro possesso, quindi, abbiamo proposto un modello denominato ‘push and go’”, aggiunge il ricercatore. “Tale modello prevede la presenza di due tipologie di magma nel sistema di alimentazione del vulcano: una più profonda, estremamente ricca in gas, e una più superficiale che tende a cristallizzare, diventando impermeabile e formando una sorta di ‘tappo’ nel cratere. Nel momento in cui si ha un aumento del flusso di gas, questo inizia ad esercitare una pressione sulla parte sovrastante e, quando la pressione non viene più sopportata, ha origine il parossismo”.
Secondo i ricercatori, è stato possibile rintracciare nei dati dei dilatometri i segnali dell’aumento di viscosità del magma superficiale: con il progredire del processo, le forme d’onda registrate sembrerebbero aver mutato la loro morfologia, presentando via via una forma sempre più smorzata e indicando - questa è l’ipotesi - che qualcosa nella parte più superficiale del sistema di alimentazione dello Stromboli stava cambiando.
“Riteniamo che questo approccio e questo modello proposto possano essere molto promettenti per il monitoraggio dello Stromboli”, conclude Mattia. “Si tratta, naturalmente, di un vulcano caratteristico, con un sistema di alimentazione molto piccolo e non confrontabile, ad esempio, con quello dell’Etna o di altri vulcani. Parossismi come quello del 3 luglio del 2019 sono, inoltre, eventi piuttosto rari, dunque per il momento disponiamo di un numero limitato di dati. Tuttavia, auspichiamo di poter estendere questo nostro studio anche alle esplosioni maggiori di Stromboli, ovvero a quelle esplosioni più forti della normale attività eruttiva ma non abbastanza da essere classificabili come parossismi. Questo ci consentirebbe di rafforzare la nostra ipotesi e di accrescere le conoscenze che abbiamo sulle fasi di unrest di questo vulcano”.
Tale contributo potrà essere utile in futuro per affinare gli strumenti di previsione e prevenzione di protezione civile ma, al momento, non ha alcuna implicazione diretta su misure che riguardano la sicurezza della popolazione.
#ingv #remotesensing #mdpi #stromboli #parossismo #vulcano
---
Stromboli. A new model proposed to interpret the paroxysm of 2019
Through a different interpretation of the data collected in the Stromboli paroxysm of 3 July 2019, scientists have developed a new functioning model of the volcano's power system
The Stromboli monitoring data were analyzed with a new approach by the scientists. The study highlighted possible further signals and mechanisms to be observed in the phases of "unrest" of the volcano. This is the hypothesis offered by the research , recently published in MDPI’s international journal ‘Remote Sensing’.
The study, conducted by a team of researchers from the Istituto Nazionale di Geofisica e Vulcanologia (INGV) in collaboration with Prof. Roberto Scarpa of the University of Salerno and with Prof. Carmelo Ferlito of the University of Catania, was carried out by analyzing a posteriori the signals that preceded the paroxysm of Stromboli on 3 July 2019.
“By observing from a new point of view the data that are normally acquired in Stromboli by our multiparametric monitoring networks”, explains Mario Mattia, researcher at INGV and first author of the study, “we were able to reconstruct the sequence of the unrest of the volcano that preceded the event of 3 July 2019”.
By analyzing the set of data available (geodetic data, satellite data, camera data, thermal and ground deformation data collected by high-precision instruments), the researchers discovered changes in the state of the volcano that could be highlighted in the moments immediately preceding the paroxysmal crisis.
“Paroxysms such as the one occurred July 3, 2019 are particularly dangerous because they produce signals that are extremely difficult to interpret: I think, for example, to the number of explosions or VLP events, that are low frequency seismic events typical of active volcanoes, which do not undergo a significant increase in the phases preceding a paroxysm”, Mattia continues. “Starting from these considerations, we focused on some specific parameters, such as the high frequency signals recorded by strainmeters, that are sensors placed in a deep hole at about 200 meters below the surface, measuring the smallest variations in ground deformations: we have found that these signals actually correspond to the VLP (Very Long Period) signals recorded by the seismographs, however they presented a specific waveform which, before 3 July, suddenly changed”.
Furthermore, using an automatic algorithm, the images taken by the surveillance cameras present in Stromboli were re-analyzed. In this way, the researchers measured an increase in the intensity and energy of the explosions starting about a month before the paroxysm of early July.
“Starting from these new reviews of the data already in our possession, we proposed a model called ‘push and go’”, the researcher adds. “This model considers the presence of two types of magma in the volcano plumbing system: a deeper one, extremely rich in gas, and a more shallow one that tends to crystallize, becoming impermeable and forming a sort of 'plug' in the crater. If there is an increase in the flow of gas, this begins to exert pressure on the overlying part and, when the pressure is no longer supported, paroxysm originates”.
According to the researchers, it was possible to trace in the data of the strainmeters the signals of the increase in viscosity of the magma: with the progress of the process, the recorded waveforms seem to have changed their morphology, gradually presenting an increasingly dampened shape and indicating - this is the hypothesis - that something in the most shallow part of the Stromboli's plumbing system was changing.
“We believe that this approach and this proposed model can be very promising for the monitoring of Stromboli”, Mattia concludes. “It is, of course, a characteristic volcano, with a very small plumbing system that cannot be compared, for example, with that of Etna or other volcanoes. Paroxysms such as that of 3 July 2019 are also quite rare events, and for the moment we have a limited number of data. However, we hope to be able to extend our study also to the major explosions of Stromboli, that are explosions stronger than the normal eruptive activity but not enough to be classified as paroxysms. This would allow us to strengthen our hypothesis and increase the knowledge we have on the unrest phases of this volcano”.
This contribution may be useful in the future to refine the tools for forecasting and prevention of civil protection but, at the moment, it has no direct implication on measures concerning the safety of the population.
#ingv #remotesensing #mdpi #stromboli #paroxysm #volcano
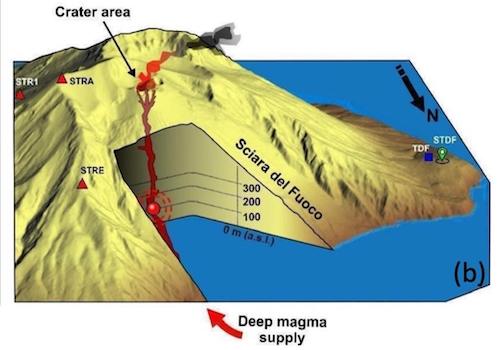
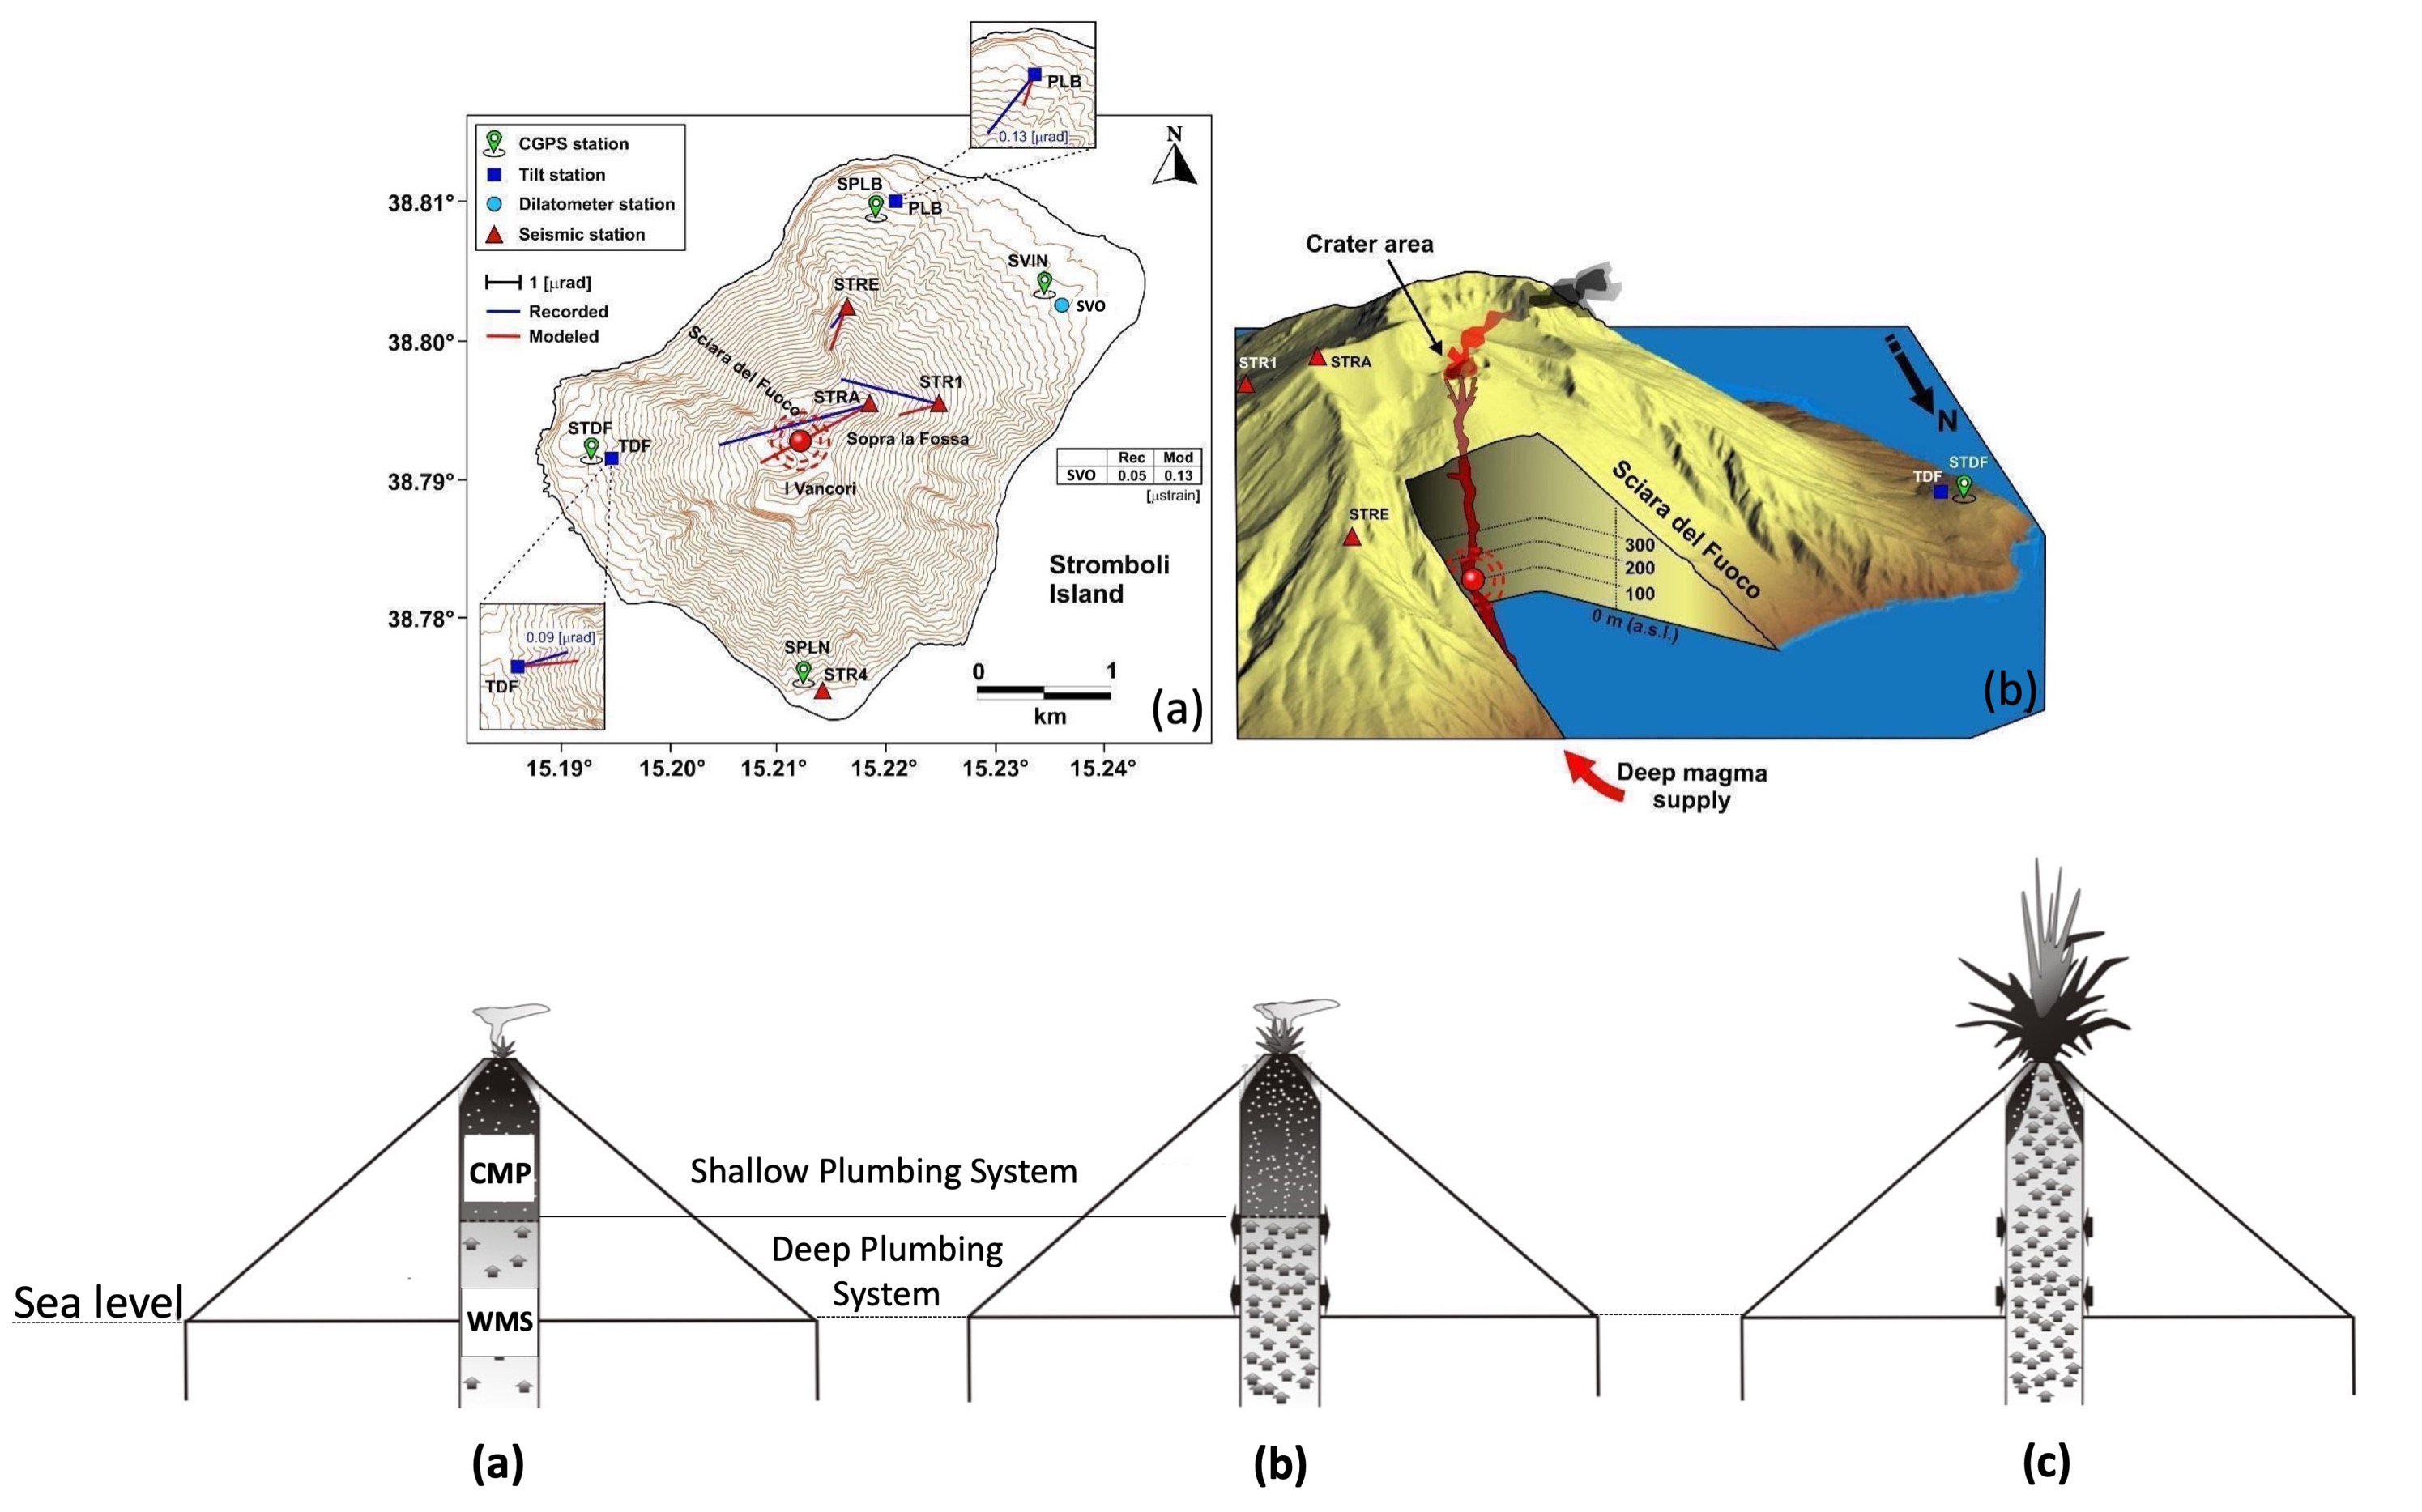 Figura 1: Modello della sorgente del parossismo di Stromboli del 3 luglio 2019 ottenuto dall'inversione dei dati geodetici e sketch che illustra il modello “push and go” - Figure 1: Model of the source of the paroxysm in Stromboli on 3 July 2019 obtained from the inversion of the geodetic data and a sketch illustrating the "push and go" model
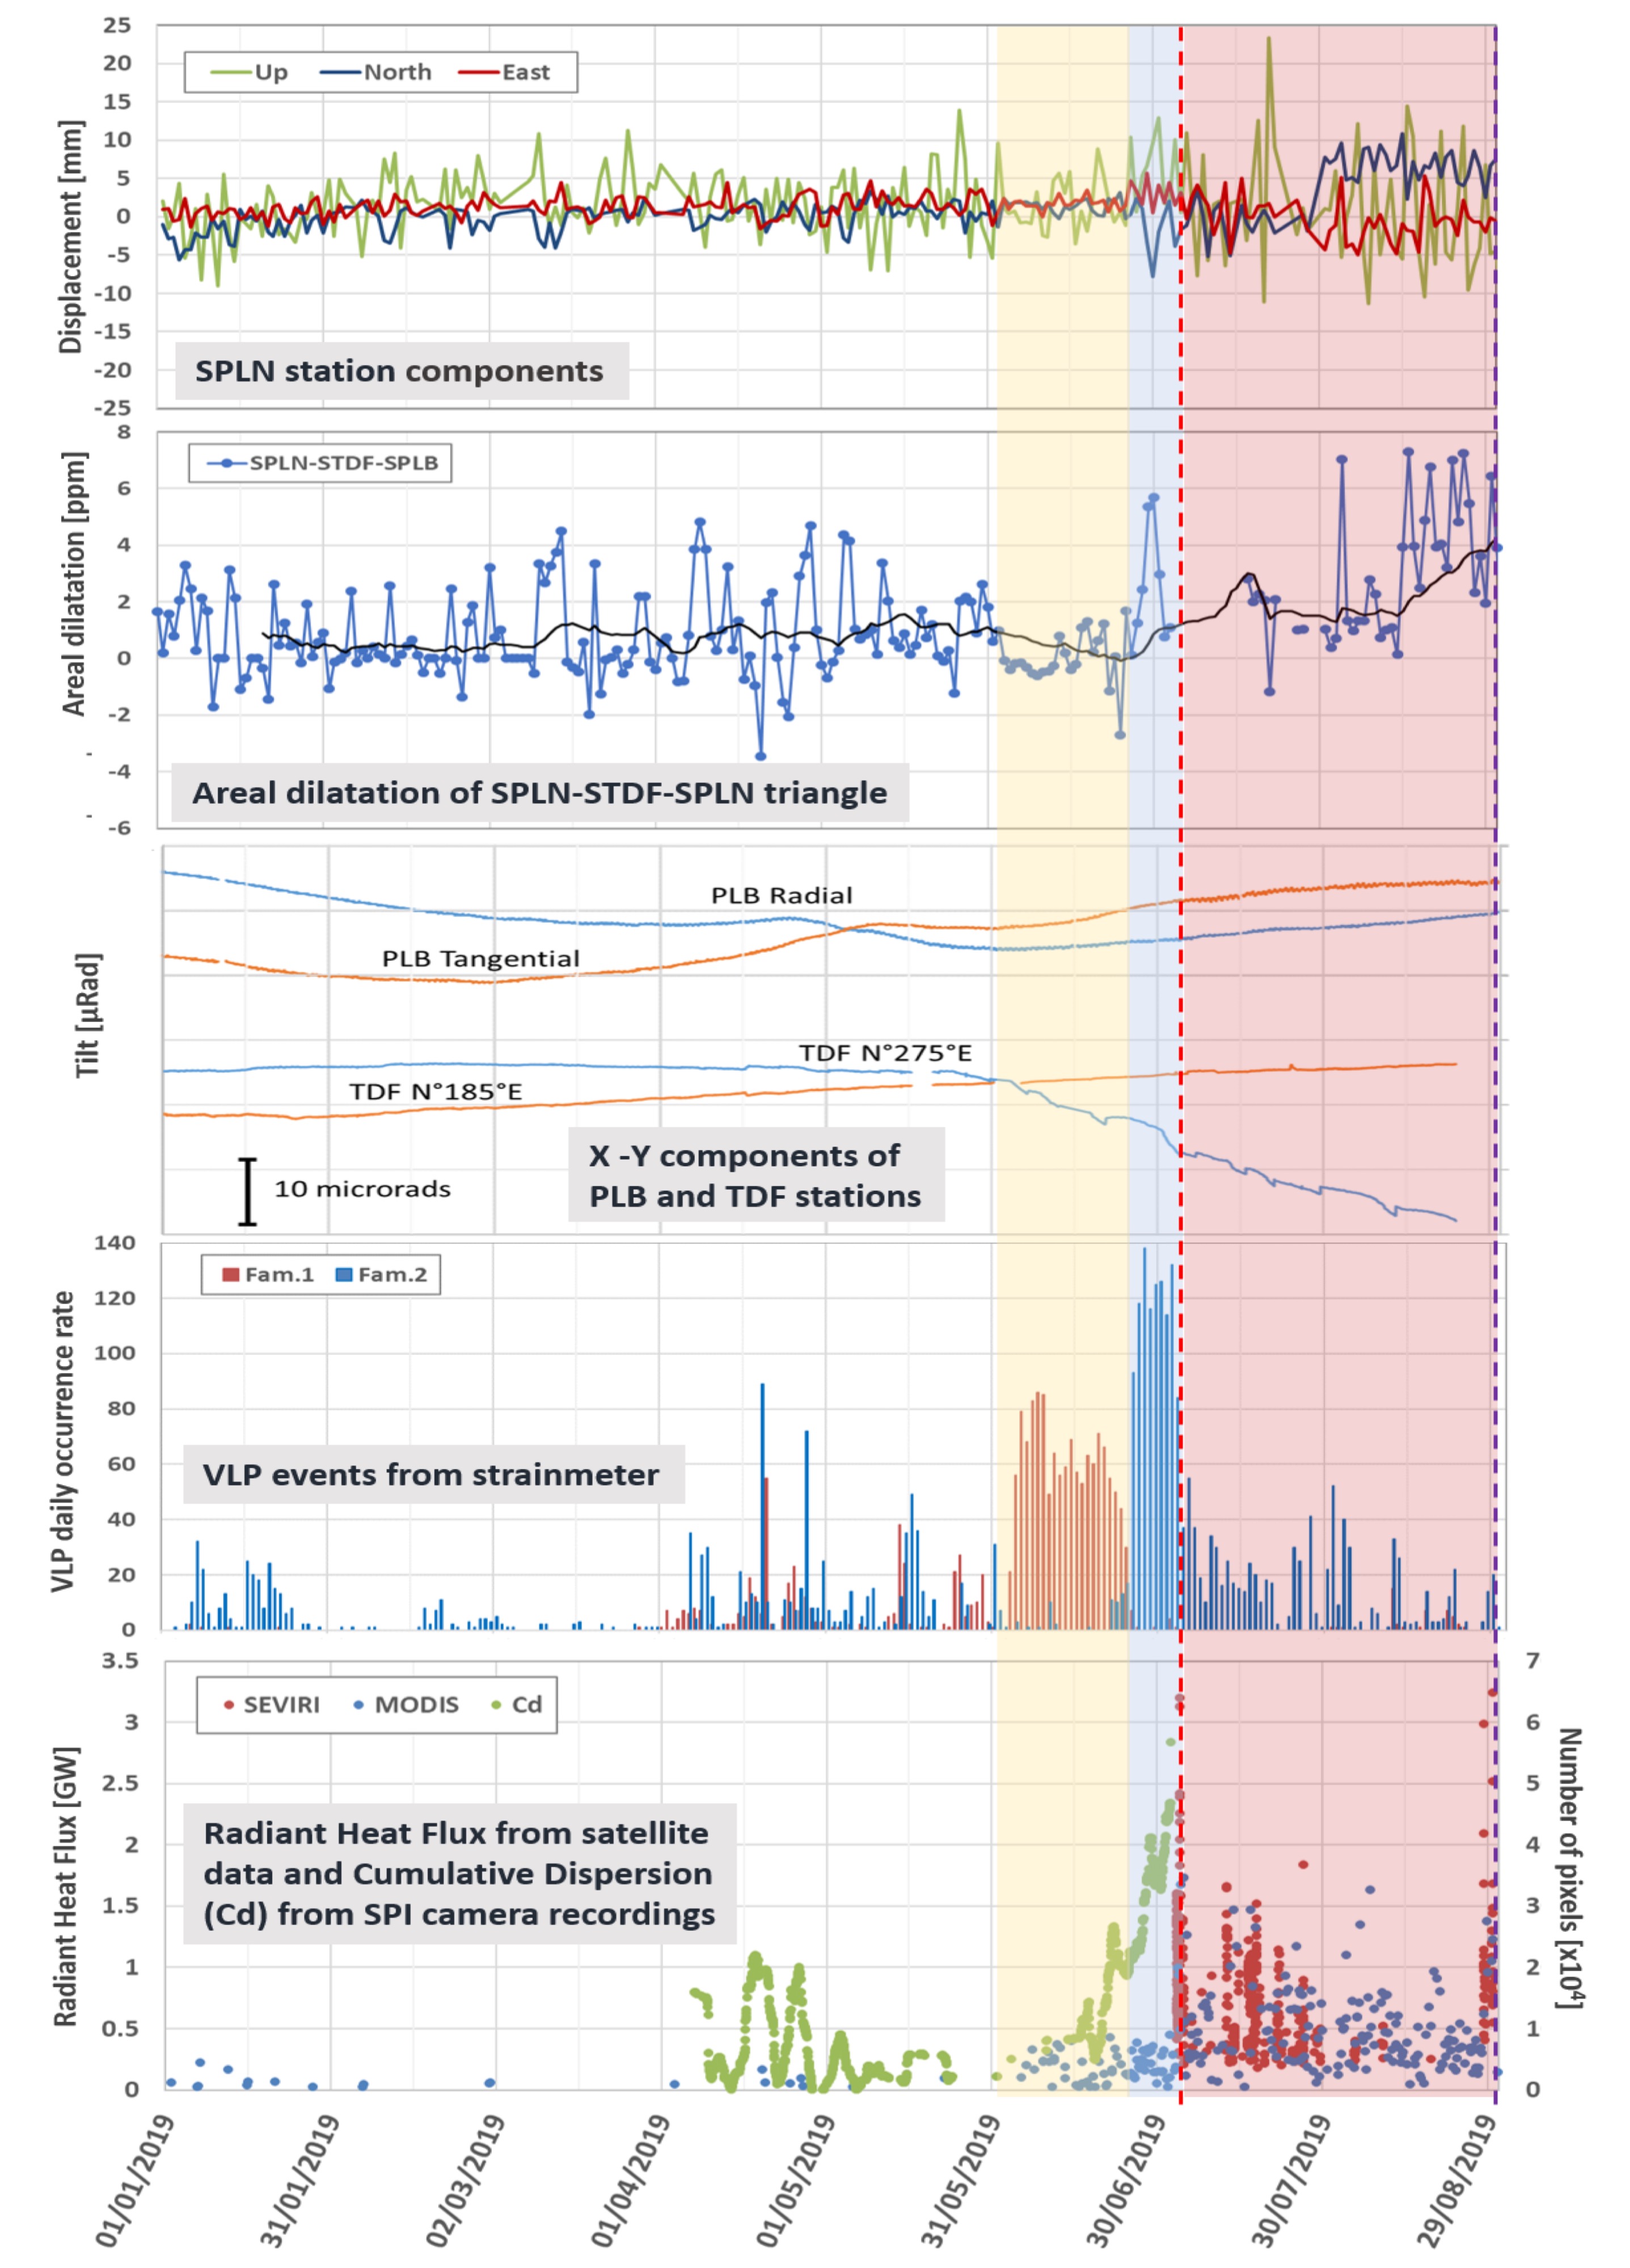 Figura 2: Grafico sinottico che mostra le variazioni di alcuni dei parametri considerati in questo lavoro, avvenute già un mese prima del parossismo del 3 luglio 2019 - Figure 2: Synoptic chart showing the variations of some of the parameters considered in this work, which occurred one month before the paroxysm of 3 July 2019