

Una innovativa lettura socio-economica delle variazioni del rumore sismico di origine antropica in Italia durante le settimane di lockdown ha consentito di interpretare in modo più approfondito l’efficacia delle misure restrittive
In alcune zone d’Italia, fortemente caratterizzate da una industrializzazione riconducibile ai settori considerati strategici per il Paese, il Governo italiano ha ravvisato la necessità, nell’ambito delle misure restrittive imposte a partire dall’11 marzo 2020, di non interrompere alcune di quelle attività.
Conseguentemente, i ricercatori hanno rilevato che il rumore sismico di origine antropica, pur attenuato, non ha subito l’importante riduzione rilevata, invece, su tutto il territorio nazionale.
È questo il risultato dello studio “COVID-19 lockdown and its latency in Northern Italy: seismic evidence and socio-economic interpretation”, appena pubblicato sulla rivista ‘Scientific Reports’ di Nature.
La ricerca, condotta da un team di ricercatori dell’Istituto Nazionale di Geofisica e Vulcanologia (INGV) e del Dipartimento di Economia e Management dell’Università di Ferrara (DEM-UNIFE), ha coinvolto un gruppo di lavoro multidisciplinare e smaterializzato ed è stata portata a termine analizzando un arco di tempo di sei settimane: due antecedenti al periodo di lockdown - utili a definire uno standard di riferimento con cui confrontare i dati - e quattro interessate dalle misure di limitazione degli spostamenti e di chiusura delle attività produttive e commerciali imposte dal Governo.
“Analizzando, per il periodo indicato, i segnali provenienti dalle stazioni della Rete Sismica Nazionale dell’INGV dislocate nel settore centro-settentrionale del Paese”, spiega Davide Piccinini, ricercatore dell’INGV e primo autore dello studio, “abbiamo potuto osservare, in alcune aree, una repentina diminuzione del rumore sismico di origine antropica che, tuttavia, non mostrava una distribuzione omogenea sul territorio, evidenziando differenze macroscopiche tra le diverse stazioni esaminate”.
Incrociando i dati sull’andamento del rumore sismico forniti dalle stazioni sismiche con quelli estratti dalle banche dati dell’Istituto Nazionale di Statistica (ISTAT) relativamente alla densità abitativa e industriale in Italia, gli autori hanno potuto correlare la mancata diminuzione del rumore in alcune zone con la presenza, in quelle stesse aree, di importanti attività produttive classificate dal Governo come realtà industriali essenziali per il Paese, che, quindi, non hanno interrotto la loro attività nemmeno durante le settimane di lockdown.
“Grazie all’elaborazione di mappe 2D della distribuzione del rumore sismico”, aggiunge Marco Olivieri, ricercatore dell’INGV e co-autore dell’articolo, “abbiamo evidenziato delle ‘regolarità’ spaziali nelle discrepanze di tale distribuzione: in alcune aree della Pianura Padana, ad esempio, vi erano gruppi di stazioni sismiche che mostravano la stessa ‘anomalia’, a indicare un fenomeno significativo. Ci siamo quindi avvalsi del contributo dei colleghi economisti per poter interpretare in maniera più esaustiva, approfondita e quantitativa questo dato”.
L’aspetto innovativo e interessante della ricerca ha riguardato, infatti, la possibilità di sopperire alla mancanza di dati dinamici sulla mobilità effettiva dei cittadini con il dettaglio necessario, con il risultato del confronto tra l’evoluzione dei livelli di rumore sismico nel tempo e il rapporto tra questa e la densità industriale e abitativa sul territorio.
Tale confronto ha evidenziato una correlazione tra la presenza di distretti produttivi la cui attività è stata indicata come economicamente non differibile e, in quelle stesse zone, la mancata drastica riduzione del rumore sismico prodotto dalle attività umane.
“Non è stato semplice combinare tra loro basi informative e ambiti scientifici così diversi”, affermano Giorgio Prodi e Federico Frattini, docenti del Dipartimento di Economia e Management dell'Università di Ferrara e coautori dell'articolo. “È piuttosto insolito trovare in letteratura studi realizzati dalla collaborazione di sismologi ed economisti. Questo studio è il risultato di una collaborazione intensa, che intendeva e ha saputo identificare alcune tendenze dell’effettivo concretizzarsi del lockdown nelle regioni del Nord Italia”.
Questo lavoro è stato concepito, realizzato e concluso durante la fase di lockdown che ha forzato tutta la Pubblica Amministrazione a lavorare in smartworking, e proprio da questa situazione ha tratto beneficio massimo, permettendo a sette persone localizzate in sei città diverse di lavorare e comunicare agilmente anche grazie alle infrastrutture informatiche e di accesso ai dati messe a disposizione da INGV e Università di Ferrara.
Link all'articolo:
#ingv #unife #covid19 #rumoresismico
Covid-19, how industrial density has influenced the reduction of seismic noise in Italy
An innovative socio-economic reading of the variations in seismic noise of anthropogenic origin in Italy during the weeks of lockdown made it possible to interpret more thoroughly the effectiveness of the restrictive measures
In some areas of Italy, strongly characterized by industrialization attributable to sectors considered strategic for the country, the Italian Government has recognized the need, as part of the restrictive measures imposed starting from 11 March 2020, not to interrupt some of those activities.
Consequently, the researchers found that the seismic noise of anthropogenic origin, although attenuated, did not undergo the significant reduction found, however, throughout the national territory.
This is the result of the study “COVID-19 lockdown and its latency in Northern Italy: seismic evidence and socio-economic interpretation”, just published in Nature’s journal ‘Scientific Reports’.
The research, conducted by a team of researchers from the Istituto Nazionale di Geofisica e Vulcanologia (INGV) and the Dipartimento di Economia e Management dell’Università di Ferrara (DEM-UNIFE), involved a multidisciplinary and dematerialized working group and was completed by analyzing a period of six weeks: two before the lockdown period - useful for defining a reference standard with which to compare the data - and four affected by the measures to limit travel and shutdown of production and commercial activities imposed by the Government.
“Analyzing, for the period indicated, the signals coming from the stations of the INGV National Seismic Network located in the central-northern sector of the country”, explains Davide Piccinini, INGV researcher and first author of the study, “we were able to observe, in some areas, a sudden decrease in seismic noise of anthropogenic origin which, however, did not show a homogeneous distribution on the territory, highlighting macroscopic differences between the various stations examined”.
By correlating data of the seismic noise reduction provided by the seismic stations with those extracted from the database of the Italian National Institute of Statistics (ISTAT) relating to the population and industrial density in Italy, the authors were able to correlate the lack of noise reduction in some areas with the presence, in those same areas, of important production activities classified by the Government as essential industrial realities for the country, which, therefore, did not stop their activities even during the weeks of lockdown.
“Thanks to the development of 2D maps of the distribution of seismic noise”, adds Marco Olivieri, researcher at INGV and co-author of the article, “we have highlighted spatial ‘regularities’ in the discrepancies of this distribution: in some areas of the Pianura Padana, for example, there were groups of seismic stations that showed the same ‘anomaly’, indicating a significant phenomenon. We therefore made use of the contribution of our economist colleagues to be able to interpret this data in a more exhaustive, in-depth and quantitative way”.
The innovative and interesting aspect of the research concerned, in fact, the possibility of making up for the lack of dynamic data on the effective mobility of citizens, with the result of the comparison between the evolution of seismic noise levels over time and the relationship between this and the industrial and housing density in the area.
This comparison highlighted a correlation between the presence of production districts whose activity was indicated as economically non-deferrable and, in those same areas, the lack of drastic reduction of the seismic noise produced by human activities.
“It was not easy to combine information and such different scientific fields”, say Giorgio Prodi and Federico Frattini, professors of the Department of Economics and Management of the University of Ferrara and co-authors of the article. “It is quite unusual to find in literature studies carried out by the collaboration of seismologists and economists. This study is the result of an intense collaboration, which intended and was able to identify some trends in the actual realization of the lockdown in the regions of Northern Italy”.
This work was conceived, carried out and concluded during the lockdown phase that forced all the Public Administration to work in smartworking, and it was precisely from this situation that it benefited the most, allowing seven people located in six different cities to work and communicate easily also thanks to the IT and data access infrastructures made available by INGV and the University of Ferrara.
Link to the article:
#ingv #unife #covid19 #seismicnoise
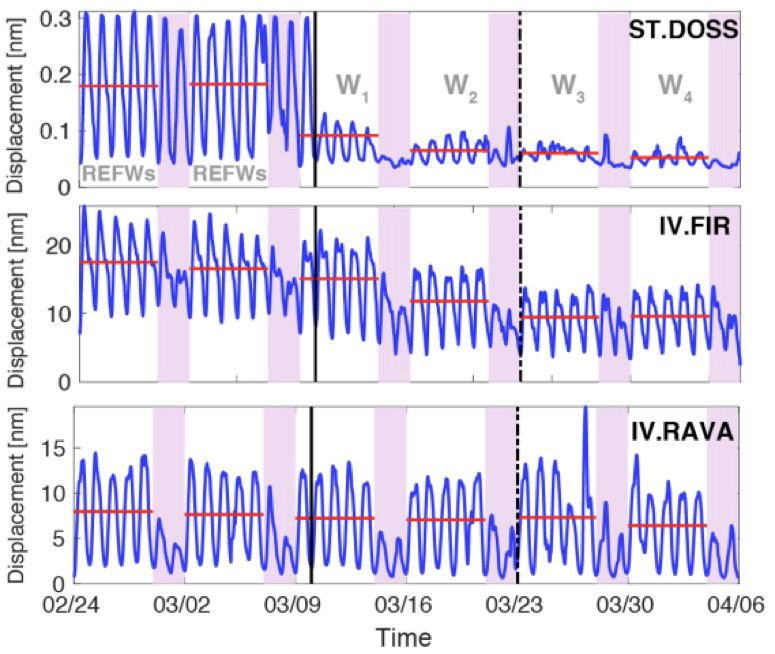
Figura 1 - Esempio dell’andamento del noise osservato a tre stazioni sismiche durante le 2 settimane precedenti (REFws nel primo pannello in alto) e per le 4 settimane successive (W1-4) alla misura di lockdown (riga nera continua). La curva blu descrive l’ampiezza del noise osservato e mostra le oscillazioni giorno/notte, mentre le barre orizzontali rosse indicano la media del noise osservato durante la settimana lavorativa. Le bande verticali rosa indicano i periodi di weekend. E’ da notare come nel caso della stazione ST.DOSS, posta in prossimità di una stazione sciistica, la riduzione del noise dopo il lockdown è repentina. Nel caso di IV.FIR posta nel centro storico della città di Firenze, la riduzione del rumore che si osserva è progressiva e si stabilizza già a partire dalla seconda settimana successiva al lockdown. Nel pannello in basso è rappresentato il noise alla stazione IV.RAVA posta in un’area rurale alle porte di Modena, costellata dalla presenza di poli industriali in cui la media del rumore osservato si mantiene praticamente costante durante tutto il periodo di osservazione.
Figure 1 - Example of the noise trend observed at three seismic stations during the previous two weeks (REFws in the first panel at the top) and for the four following weeks (W1-4) to the lockdown measurement (continuous black line). The blue curve describes the amplitude of the observed noise and shows the day/night oscillations, while the red horizontal bars indicate the average of the noise observed during the working week. The vertical pink bands indicate the weekend periods. It should be noted that in the case of the ST.DOSS station, located near a ski resort, the noise reduction after the lockdown is sudden. In the case of IV.FIR located in the historic center of the city of Florence, the noise reduction observed is progressive and stabilizes as early as the second week following the lockdown. The bottom panel shows the noise at the IV.RAVA station located in a rural area on the outskirts of Modena, dotted with the presence of industrial poles where the average of the observed noise remains practically constant throughout the observation period.
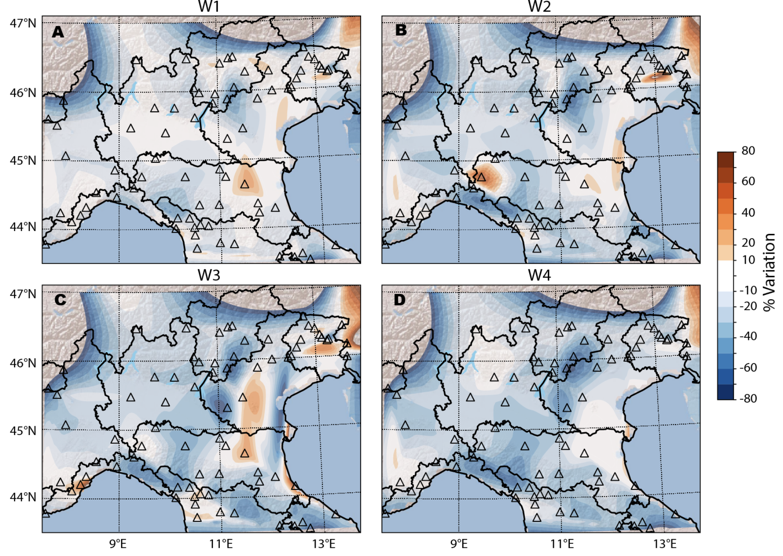
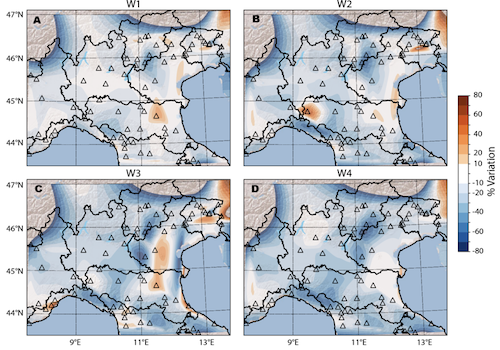
Figura 2 - Mappe della variazione del rumore sismico osservato, espresso in termini di riduzione percentuale rispetto alle settimane precedenti il lockdown. I triangoli rappresentano l’ubicazione dei 78 siti usati per effettuare questo studio. Si nota come in ampie zone dell’Italia settentrionale la riduzione del rumore durante le prime due settimane sia stata molto ridotta così come indicato dalle tonalità più tenue della scala di colore che ne codifica la variazione percentuale.
Figure 2 - Maps of the observed seismic noise variation, expressed in terms of percentage reduction compared to the weeks prior to the lockdown. The triangles represent the location of the 78 sites used to carry out this study. It is noted that in large areas of northern Italy the reduction of noise during the first two weeks was very low as indicated by the more tenuous shades of the color scale that encodes the percentage variation.