Evidenziato il processo interattivo tra la risalita dei magmi, le eruzioni e lo scivolamento verso il mare del fianco orientale dell’Etna, spesso associato ad eventi sismici.
Lo scivolamento del fianco orientale dell’Etna agisce come una valvola che favorisce o inibisce le eruzioni nel settore immediatamente a monte; la variazione della velocità di scivolamento stesso può essere considerata come una sentinella per eventuali eruzioni parossistiche e/o processi di intrusione di magma. Questo il risultato raggiunto nello studio appena pubblicato sulla rivista statunitense Geology dal titolo “Flank sliding: A valve and a sentinel for paroxysmal eruptions and magma ascent at Mount Etna, Italy”, frutto del lavoro di un team di ricercatori dell’Istituto Nazionale di Geofisica e Vulcanologia (INGV) e dell’Istituto Superiore per la Protezione e la Ricerca Ambientale (ISPRA)
“Attraverso un approccio multidisciplinare che ha visto l'utilizzo del telerilevamento SAR, del GPS e della tomografia sismica”, spiega Giuseppe Pezzo, autore della ricerca, “abbiamo analizzato le deformazioni del suolo nell’area etnea relative all’evento eruttivo del 24 dicembre 2018 e all’evento sismico avvenuto due giorni dopo, il 26 dicembre”. “In particolare”, prosegue il ricercatore, “l’interferometria satellitare SAR, attraverso l’uso di immagini satellitari radar, ci ha permesso di ottenere mappe delle deformazioni del suolo di tutta l’area etnea. Le misure ottenute sono state integrate con quelle provenienti dalla rete GPS, che misura in maniera continua i movimenti del vulcano. Infine, con la tomografia sismica, attraverso lo studio delle onde sismiche, è stata ricostruita la struttura al di sotto dell’edificio vulcanico. Questa complessa analisi multidisciplinare ha evidenziato come il continuo movimento del fianco orientale dell’Etna ha favorito, nel tempo, l’intrusione di magmi nell’area immediatamente a monte il collasso stesso, nelle zone di frattura note come Rift di Nord-Est e di Sud dell’area sommitale del vulcano. La geometria e l’ubicazione di questi volumi di magma appare coerente con antiche strutture tettoniche, messe in evidenza dai dati di tomografia sismica, che dislocano la crosta sotto l’edificio vulcanico favorendo la risalita di magmi verso la superficie”.
“Le risalite magmatiche”, prosegue Mimmo Palano, coautore della ricerca, “a causa delle pressioni interne dei magmi, provocano un allargamento di diversi metri di tutto l’edificio vulcanico e imprimono un'accelerazione al movimento del fianco orientale”.
“Questa accelerazione” conclude Claudio Chiarabba, coautore della ricerca”, determina, a sua volta, due effetti: provoca eventi sismici lungo le faglie che bordano il fianco instabile (come, ad esempio, il sisma del 26 dicembre 2018 di magnitudo pari a 4.9 lungo la faglia della Fiandaca), e genera una depressurizzazione della parte interessata dall’eruzione arrestando la stessa”.
#ingv #etna #eruzioni #terremoti
---
Flank sliding: a valve and a sentinel for paroxysmal eruptions and magma ascent at Mount Etna.
Researchers highlighted the interactive process between the magma ascents, the eruptions and the seawards sliding of the eastern flank of Mount Etna, frequently associated with seismic events.
The sliding of the eastern flank of Etna acts as a valve that favors or inhibits eruptions back to sliding plane; the variation of the sliding velocity could be considered as a sentinel for possible paroxysmal eruptions and / or deep resourcing of the magma reservoir.
This is the result achieved in the study just published in the US journal Geology entitled "Flank sliding: A valve and a sentinel for paroxysmal eruptions and magma ascent at Mount Etna, Italy". The study was conducted by a team of researchers from the Italian National Institute of Geophysics and Volcanology (INGV) and from the Italian Institute for Environmental Protection and Research (ISPRA).
"By means of a multidisciplinary approach embracing SAR remote sensing, GPS and seismic tomography", explains Giuseppe Pezzo, author of the research, "we analyzed the ground deformations of the Etna volcano related to the 24 December 2018 eruptive event and to the seismic event that occurred two days later, on 26 December". "In particular”, continues the researcher, "satellite SAR interferometry, using radar satellite images, allowed us to obtain ground deformation maps of the Etna area. The obtained measurements were integrated with data coming from the GPS network, which continuously measures the displacements of the volcano. Finally, seismic tomography methods, through the study of seismic waves, allowed us to reconstruct the structure underneath the volcanic edifice. This complex multidisciplinary analysis highlights how the continuous slip of the eastern flank of Etna over time favors the magma intrusion eruptions back to sliding plane itself, in the volcano summit fractures, known as the North-East and South Rift. The geometry and location of the magma volumes are consistent with ancient tectonic structures dislocating the crust under the volcanic edifice, as highlighted by seismic tomography data, and favoring the upward magma ascent".
"The magma rising", continues Mimmo Palano, co-author of the research, "due to the internal pressures, causes a few meters widening of the entire volcanic edifice and gives an acceleration to the eastern flank collapse".
"In turn, this acceleration" concludes Claudio Chiarabba, co-author of the research "determines two effects: it causes seismic events along the faults bordering the unstable flank (such as, for example, the Magnitude 4.9 earthquake occurring on 26 December 2018 along the Fiandaca fault), and the cessation of the eruption for the sudden depressurization back to the collapse plane".
#ingv #etna #eruptions #earthquakes

Figura 1 Valle del Bove (Monte Etna, 2019). Nell’immagine è possibile vedere la colata lavica del dicembre 2018
Figure 1 Valle del Bove (Mount Etna, 2019). Picture shows the December 2018 lava flow.

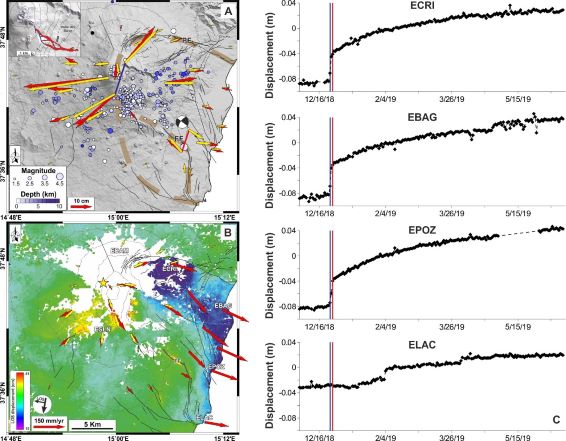
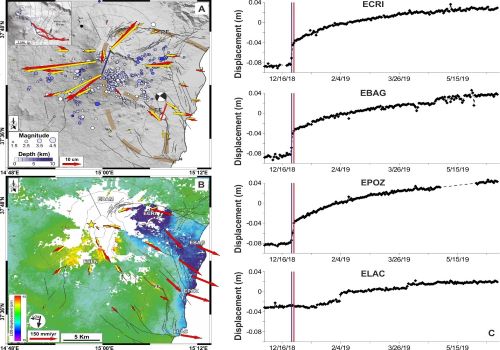
Figura 2 - A) Spostamenti registrati dalle stazioni GPS tra il 22 e il 28 dicembre 2018; sono anche rappresentati gli eventi sismici. B) Mappa dell’area etnea in cui sono rappresentate le velocità di spostamento misurate tra il 28 dicembre 2018 e giugno 2019, attraverso l’interferometria SAR, lungo la line di vista del satellite. Le frecce rappresentano le velocità GPS nello stesso intervallo temporale. Nei pannelli A e B le frecce rosse rappresentano le misure osservate, mentre quelle gialle sono il modello analitico calcolato per definire la sorgente di deformazione. Sulla destra sono rappresentati gli spostamenti verso Est registrati da alcune stazioni GPS tra il 28 dicembre 2018 e giugno 2019.
Figure 2 - A) Ground displacements measured by GPS stations in 22-28 December 2018 time interval; seismic events are also reported. B) Etna area map showing displacement velocities along the line of sight of the satellite, obtained by means multitemporal SAR interferometry technique, in the 28 December 2018 and June 2019 time window. The arrows represent the GPS velocities in the same time span. In panels A and B, the red arrows are the observed measurements, whereas the yellow ones represent the analytical model calculated to define the deformation source. On the right, the corresponding GPS displacement time series showing the eastward acceleration until June 2019.

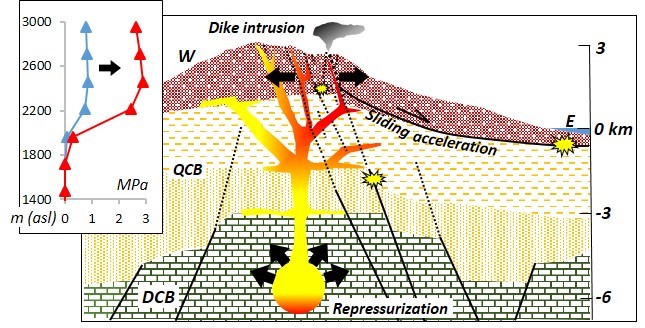
Figura 3 - Rappresentazione schematica dei processi in atto.
Figure 3 – Schematic representation of the processes in progress. Inset represents depressurization vertical profiles due to flank collapse, back to sliding plane.


